OOO OOO
OOO OOO
OOOOO
OOOOO OOOOOO
OOOOO
OOOOOOOOOO OOOOOO
OOO OOOO OOOO OOO
OOO OOOO OOO
OOO OOOO OOOO OOO
OOO
OOOOOOOOOO OOOOOOO
OOO OOO
OOOOOO OOOOOOO
OOO OOO
OOOO
John Chubb
Instrumentation Unit 30,
Lansdown Industrial Estate, Gloucester Road,
Cheltenham, GL51 8PL,
UK. Tel: +44 (0)1242 573347
Fax: +44 (0)1242 251388
email: jchubb@jci.co.uk
_________________________________________________________________________________________________
&nbs
p;
USER MANUAL: JCI 255 CALIBRATOR UNIT
UM255 - Issue 2: September 2001
Contents:
1. Introduction
2. Operational features
3. Calibration procedure
4. Personnel safety
5. Specification features
References
Annex 1: Calibration of corona charge
decay measuring instrumentation
USER
MANUAL: JCI
255 CALIBRATOR UNIT
for formal calibration of JCI 155v4 and JCI 155v5 Charge Decay Test
Units to BS 7506: Part 2: 1996
1.
INTRODUCTION
Calibration of corona charge decay measurement instruments such as the JCI 155v5 and JCI 155 v4 involves two parts: calibration of the sensitivity for surface voltage measurement and calibration of the decay time measurement performance. The JCI 255 Calibrator unit enables these two aspects to be formally calibrated to the procedure set out in BS 7506: Part 2: 1996 [1] using measurements whose accuracy is traceable to National Standards. The unit can also be used to spot check for correct operation of charge decay measuring instruments.
The basic arrangement for calibration is to mount an isolated flat metal plate close up across the area of the test aperture of the JCI 155. To this plate calibrated voltages are applied for calibrating the fieldmeter response in terms of a uniform voltage across the whole test aperture area. Combinations of calibrated good quality, high voltage resistors and capacitors are connected between the plate and earth to provide defined values of RC decay time constants. The practical arrangement is illustrated in Figure 1. The JCI 255 implementation is shown in Figure 2 and Figure 3 shows a JCI 155v5 positioned on a JCI 255.
2.
OPERATIONAL FEATURES
The JCI 255, as illustrated in Figure 2, is a diecast aluminium box with side and end location guides provided to define a location for a JCI 155 Charge Decay Test Unit resting on its upper surface. The JCI 155 is positioned so its test aperture is over the test plate. The earth bonding poinbt of the JCI 155 is connected to the earth (green) terminal on the JCI 255.
Two bayonet pin connector sockets at the front end of the unit are mounted in good quality insulation. The upper socket is connected directly to the test plate and the lower to the two common socket positions in the insulation on the back plate. The back plate mounts three calibration resistors on the right hand side (nominally 10, 100 and 1000M) and four calibration capacitors on the left hand side (nominally 1, 10, 100 and 1000nF). These resistors and capacitors are connected by the jumper connector leads to the common bayonet pin socket mounted at the centre of the arcs of sockets.
For voltage calibration: a calibrated high voltage supply, 0 - +1000V, is connected directly to test plate via the upper of the two sockets on the front of the unit with the lower socket left unconnected.
For decay time calibration: the two sockets on the front plate are linked together and connection jumpers are used as links between the two common sockets and one resistor and one capacitor socket position. The high voltage corona charging capability of the JCI 155 is used to put sufficient charge to the resistor/capacitor combination that a suitable initial peak voltage is achieved for decay time calibration. The corona voltage and duration are adjusted to achieve suitable initial peak voltages for calibration.
An earthing connector is provided in the middle of the back plate insulation for earthing the JCI 255 unit when making voltage calibrations using an external high voltage supply.
Decay time values (in milliseconds) are given by the product of the values of resistors (in megohms, M) and capacitors (in nanoFarads, nF):
t = R C
Thus a nominal 1nF capacitor and 1000M resistor will give a decay time around 1 second. Exact decay time values will be the product of the actual calibrated values.
3.
CALIBRATION PROCEDURE
The procedure for formal calibration of JCI 155 charge decay test units is presented in Annex 1. With JCI 155v5 instruments calibration is made in relation to readings shown on the instrument display. With JCI 155v4 instruments calibration results are taken both from the instrument display and from measurements made using software DECAY18.
Car e needs to be taken in charging the capacitors to avoid achieving voltages much above about 1000V. If higher voltages occur then the capacitors may be damaged. In carrying out decay time calibration it is therefore necessary to be careful to select combinations of corona voltage and duration to give suitable values of initial peak voltages. Typically for 1nF a corona voltage of 5-7kV and a duration of 20ms will be suitable. For longer decay times the duration will need to be increased ? by about a factor of x10 or each decade increase in capacitance.
For decay time calibration of JCI 155v4 instruments it is desirable to achieve initial peak voltages over 100V. With lower voltages signal noise will adversely affect decay time values. Decay timing on the instrument is made from the maximum of the initial peak signal to the minimum of the end point timing voltage. This is because these decisions are made using analogue comparator circuits. In DECAY18 software there is some averaging of signals, particularly those with longer decay times, so decay times measurements are better. With JCI 155v5 instruments decay timing is based on ?stutter timing? in which the timing clock is started and stopped according to whether the instantaneous signal is above or below the particular voltage level. This approach provides a simple way to obtain a good average on signals with appreciable levels of noise. Hence the initial peak voltages do not need to be as high on JCI 155v4 instruments.
It is suggested that calibration is pursued in the following steps:
1. Set for 5kV and 20ms corona negative.
2. Select 1n and 1000M
3. Make a test run and check the initial peak voltage is within the range 100V to 1000V and that the decay time (to 36.8%) shown is close to 1 second and check
4. Make the 3 negative and 3 positive corona tests as required in the formal test procedure (see Annex A1.5.2)
5. Calibrate with 1n and 100M (nominal 0.1s)
6. Set for 10n and 1000M (nominal 10s) and check the initial peak voltage is within the range 100V to 1000V. If not then increase the corona voltage and/or corona time settings. Retest and check the initial peak voltage is within the range 100V to 1000V
7. Make the 3 negative and 3 positive corona tests as required in the formal test procedure (see Annex A1.5.2)
8. Calibrate with 10n and 100M (nominal 1s)
9. Set for 100n and 1000M (nominal 100s) and check the initial peak voltage is within the range 100V to 1000V. If not then increase the corona voltage and/or corona time settings. Retest and check the initial peak voltage is within the range 100V to 1000V
10. Make the 3 negative and 3 positive corona tests as required in the formal test procedure (see Annex A1.5.2)
11. Calibrate with 100n and 100M (nominal 10s)
12. Set for 1000n and 1000M (nominal 1000s) and check the initial peak volt age is within the range 100V to 1000V. If not then increase the corona voltage and/or corona time settings. Retest and check the initial peak voltage is within the range 100V to 1000V
13. Make the 3 negative and 3 positive corona tests as required in the formal test procedure (see Annex A1.5.2)
Because very high value resistors are used to provide the longest decay time, 1Gohm (109 ohms) it is important that all insulating surfaces are kept clean and gaps are free of dust, debris and dirt. The quality of the insulation should be checked before any calibration measurements by leaving the resistors and capacitors unconnected and applying a small amount of corona charge to the test plate and its connections (for instance ?3kV for 20ms). The decay time in this arrangement should be well over 100s.
If the surface of the test plate becomes contaminated this may affect the initial form of the decay curve ? for example over the first 50ms. This surface should be kept clean to avoid any s uch problems. It is also wise to examine the initial form of a few decay curves to check that no problems are arising.
4. PERSONNEL SAFETY
The insulated jumper connection leads supplied provide operator protection against contact with surfaces that may be at high voltages. Operators need to avoid contact with leads when high voltages are or maybe present. It will be wise to check from the surface voltage reading on the JCI 155 that the voltage of the test plate has fallen to a suitably low level before connecting links are changed or possible hand contact made to the test plate.
5. SPECIFICATION FEATURES
|
Nominal values of capacitance |
1, 10, 100 & 1000nF |
|
Nominal values of resistors |
10M, 100M, 1000M |
|
Nominal values of decay times |
0.01s, 0.1s, 1s, 10s, 100s & 1000s |
|
Maximum operating voltage |
1000V |
The specific values for the resistors and capacitors are determined by formal calibration at an approved test laboratory with traceability of measured values and their accuracy to National Standards. A formal cal ibration is provided with the unit at purchase. Recalibration should be performed annually.
References:
[1] British Standard BS 7506: Part 2: 1996 "Methods for measurements in
electrostatics"
Annex
1: CALIBRATION OF CORONA CHARGE DECAY MEASURING INSTRUMENTATION
A1.1 Aspects
to be calibrated
Calibration of charge decay measurement instrumentation involves two parts: calibration of the voltage sensitivity of the fieldmeter and calibration of the decay time measu rement performance.
A1.2 Equipment
Calibration of the charge decay measuring instrumentation is made using a plane conducting surface covering the whole test aperture area with a small separation (less than 0.5mm) below the edge of the test aperture so calibration voltages can be applied.
Very high value resistors are used to provide the longest decay time, 1Gohm (109 ohms). It is therefore important that all insulating surfaces are kept clean and insulating gaps are free of dust, debris and dirt. The quality of the insulation should be checked before any calibration measurements by leaving the resistors and capacitors unconnected and applying a small amount of corona charge to the test plate and its connections. The decay time in this arrangement should be well over 100s.
If the surface of the test plate becomes contaminated this may affect th e initial form of the decay curve. This surface should be kept clean to avoid any such problems. It is also wise to examine the initial form of a few decay curves to check that no problems are arising.
A1.3 Voltage
sensitivity calibration
The voltage sensitivity calibration is made in terms of a uniform potential on the conducting surface covering the whole test aperture area.
The voltage source shall provide a stable, low ripple voltage of both polarities to at least 1000V. The voltage measuring system shall cover the measurement of both polarities and be separate from the voltage source so it may be formally calibrated independently. The accuracy of voltage measurement shall be better than 0.2%. The stability of the calibration voltage shall be 0.2%.
A1.4 Decay
time calibration
Calibrated resistors and capacitors are connected in parallel between earth and the conducting calibration plate over the test aperture. The resistors and capacitors shall be of good quality, with linear characteristics with voltage and be capable of withstanding voltages up to over 1kV.
Decay time values in seconds are derived from the product of the values of the resistors (ohms) and capacitance (farads). Decay time values shall be provided for each decade of time over the main operating range of the instrument. To cover the range of interest of materials used for static control the decay time values provided should cover the range 0.1s to 100s.
Formal calibration of the resistors and capacitors shall be made as connected to the test surface in the equipment as used for calibration of the charge decay instrumentation.
A1.5 Calibration
procedure
A1.5.1 Voltage
calibration
Mount the charge decay measuring instrument on the calibration equipment, switch on and allowed to stabilise. Connect the calibration plate to earth and measure the initial ?zero? surface voltage reading.
Apply calibrated voltages to the test plate to give readings at well spaced voltage levels fro m 50V to 1000V. Repeat measurements for the other voltage polarity.
A1.5.2 Decay
time calibration
Connect a combination set of resistance and capacitance values from earth to the calibration plate. Operate the charge decay measuring instrument to apply sufficient charge to the calibration plate to achieve an initial peak surface voltage suitable for decay time measurement. Initial voltages in the range 100V to 1000V are convenient. Measure the time from the initial peak voltage to 1/e of this using the normal instrument charge decay time measurement facilities. If both electronic and software decay time measurement facilities are available then both shall be used together.
At least 3 decay time measurements shall be made for each charge polarity for each decay time range. From each set of 6 readings the average decay time value and the standard deviation shall be calculated.
A1.6 Results
The results of the voltage sensitivity and the decay time calibrations shall be recorded on a Calibration Certificate.
For a new instrument supplied direct from the manufacturer the values recorded shall indicate these are ?as dispatched? values. Where an instrument is returned for recalibration then the ?as received? values shall be indicated. If no adjustments to the instrument are needed then the values shall be indicated to be ?as received and as dispatched?. If any changes or adjustments are made then the instrument is recalibrated in the sealed condition ready for dispatch and both ?as received? and ?as dispatched? values are shown.
The following information shall be shown on the Calibration Certificate:
- the name of the organisation issuing the Certificate
- Certificate number
- Customer identity
- Instrument type number
- Instrument serial number
- Date of calibration
- Name and signature of authorised signatory
- Method of calibration used and reference number of Standard
- Overall accuracy of calibration
- List of applied voltages and corresponding surface voltage values for both polarities
- List of measured decay time values (average values and standard deviations) and list of decay time values expected from actual resistance and capacitance values.
- Reference information on the date and place of calibration of the measuring instruments used and the accuracy of their calibration
Figure 1: JCI 155 Charge
Decay Test Unit on JCI 255 Calibrator Unit
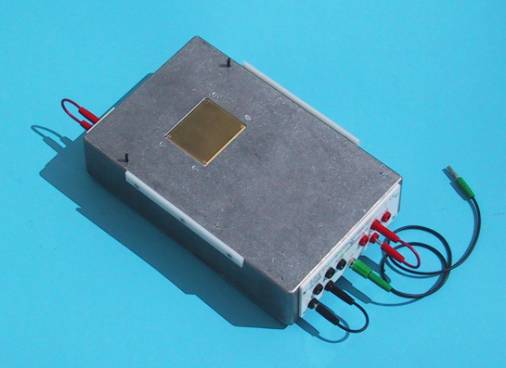
Figure 2: JCI 255
Calibrator Unit
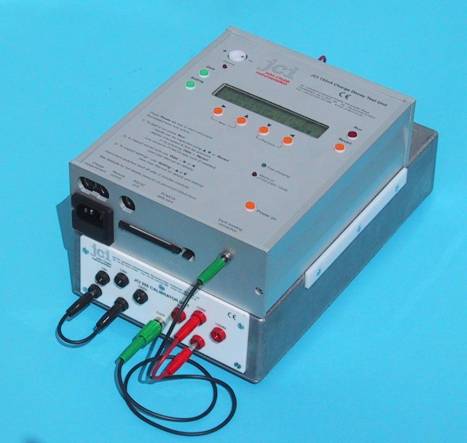
Figure 3: JCI 155v5
positioned on JCI 255 Calibrator Unit